Debugging
As we mentioned in Chapter 2, a web application is not a single piece of software. It consists of the server running PHP code, the client (browser) running Javascript and rendering the web page, and the conversation between the two parties. Things can go wrong in any of these three places.
Client-side Debugging
When your application "doesn't work", it's not always obvious in which of these three places the problem lies. In general, it's best to start debugging problems on the client side unless you already have a pretty good idea that the problem lies in your server-side code. Fortunately, modern web browsers come with a built-in tool for identifying problems in client-side code, as well as problems in the communication between your browser and the server. This tool is called the browser console.
The browser console can show you error and debug output from the Javascript interpreter, as well as the specific requests that your browser makes and the responses that it gets from the server. It also lets you explore the DOM (the Document Object Model, which is basically the HTML that is rendered in the browser at any given moment), and the specific sequence of CSS transformations that are being applied to each HTML element.
Firefox
To open the console in Firefox, use the following shortcuts:
- Windows: Ctrl + Shift + K
- MacOS: Cmd + Opt + K
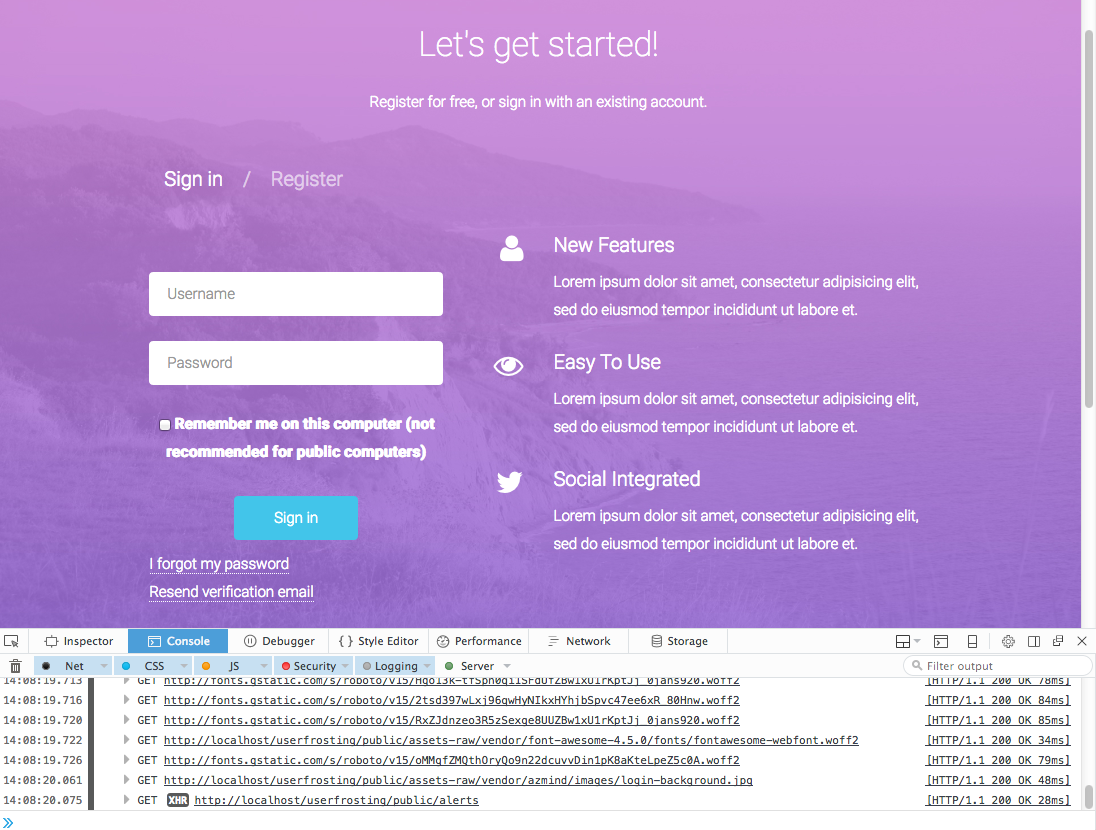
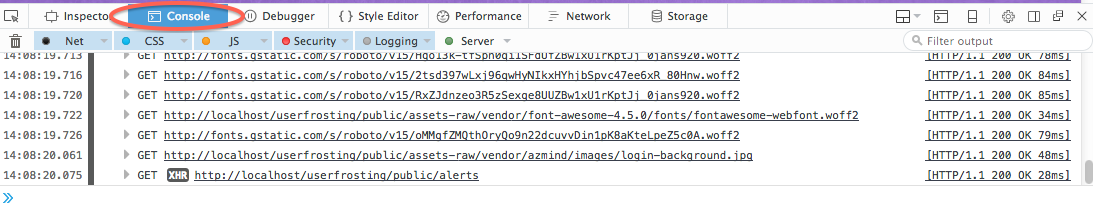
The tool panel will open (usually docked at the bottom) and you'll notice some tabs at the top of this panel: Inspector, Console, Debugger, Style Editor, Performance, Network, and Settings. By default, the Console tab should be selected (if not, click it).
Underneath that, you'll probably see a long list of URLs. These are the requests that your web browser has made so far. To the left of each URL is the request method (GET, POST, PUT, DELETE, etc). To the right is the server response summary. For example, the server responded HTTP/1.1 200 OK for the request to http://localhost/userfrosting/public/alerts. The status code 200 is used to mean that the request completed "successfully". "Success" is something that your server defines - it's just a way for the server to tell your browser that everything went as expected and that it doesn't need to do anything else.
If you click the response summary, Firefox will open the Network tab and show you more details about the request:
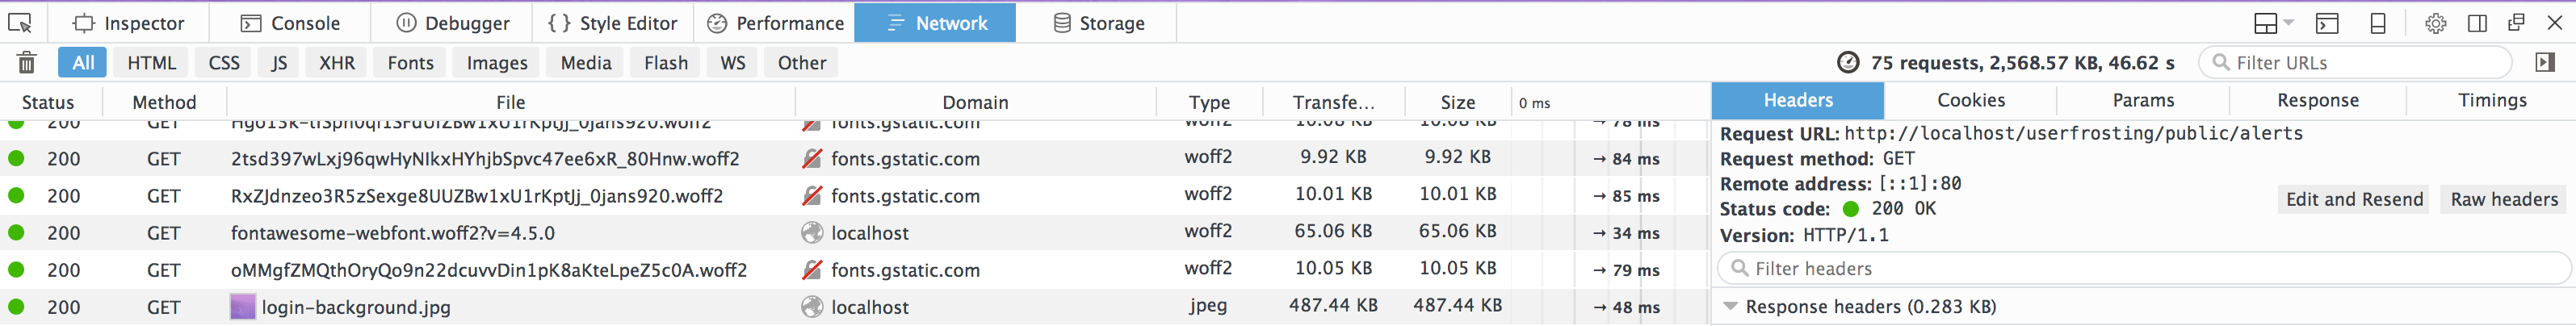
To the right, you'll see tabs for Headers, Cookies, Params, Response, and Timings. If you scroll down in the Headers tab, you'll see a list of the request and response headers. The request headers contain metadata sent with a particular request, and contain information about your browser, the contents of any cookies for the site, and other information. The response headers contain metadata returned by the server for that request. This can include information like cookies that the site wants the client to store or update, as well as things like the type of content (HTML, image, CSS, JSON, etc) being returned.
The Cookies tab just displays the contents of any cookie headers in a more easily read format.
Params tab
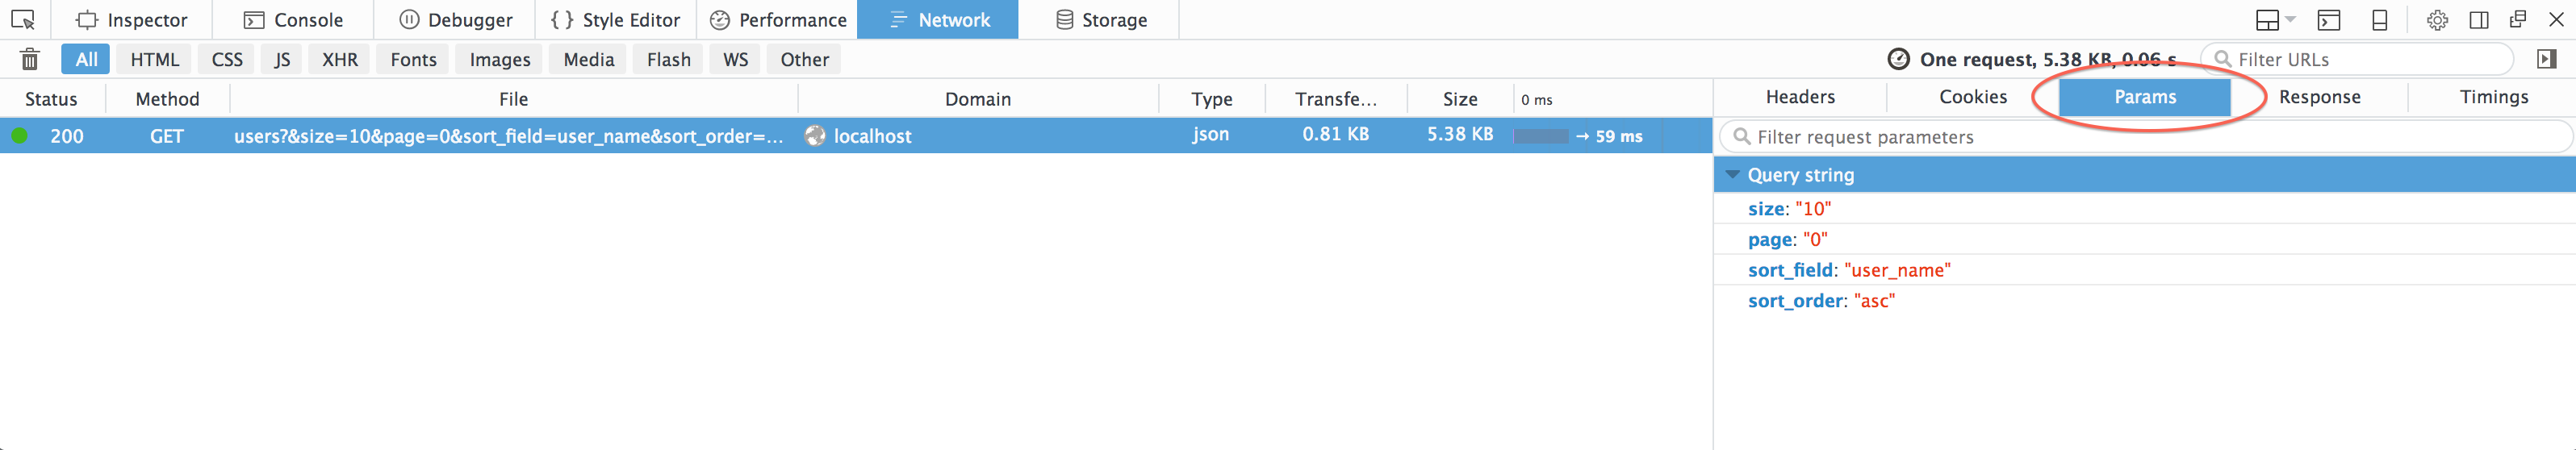
Params shows any data sent in the body of the request. This is extremely useful for debugging client-side code. Often times, a web application appears to "not work" because the server isn't actually being sent the data it expected. The Params tab is a good way to check the actual data that was sent with a particular request.
Response tab
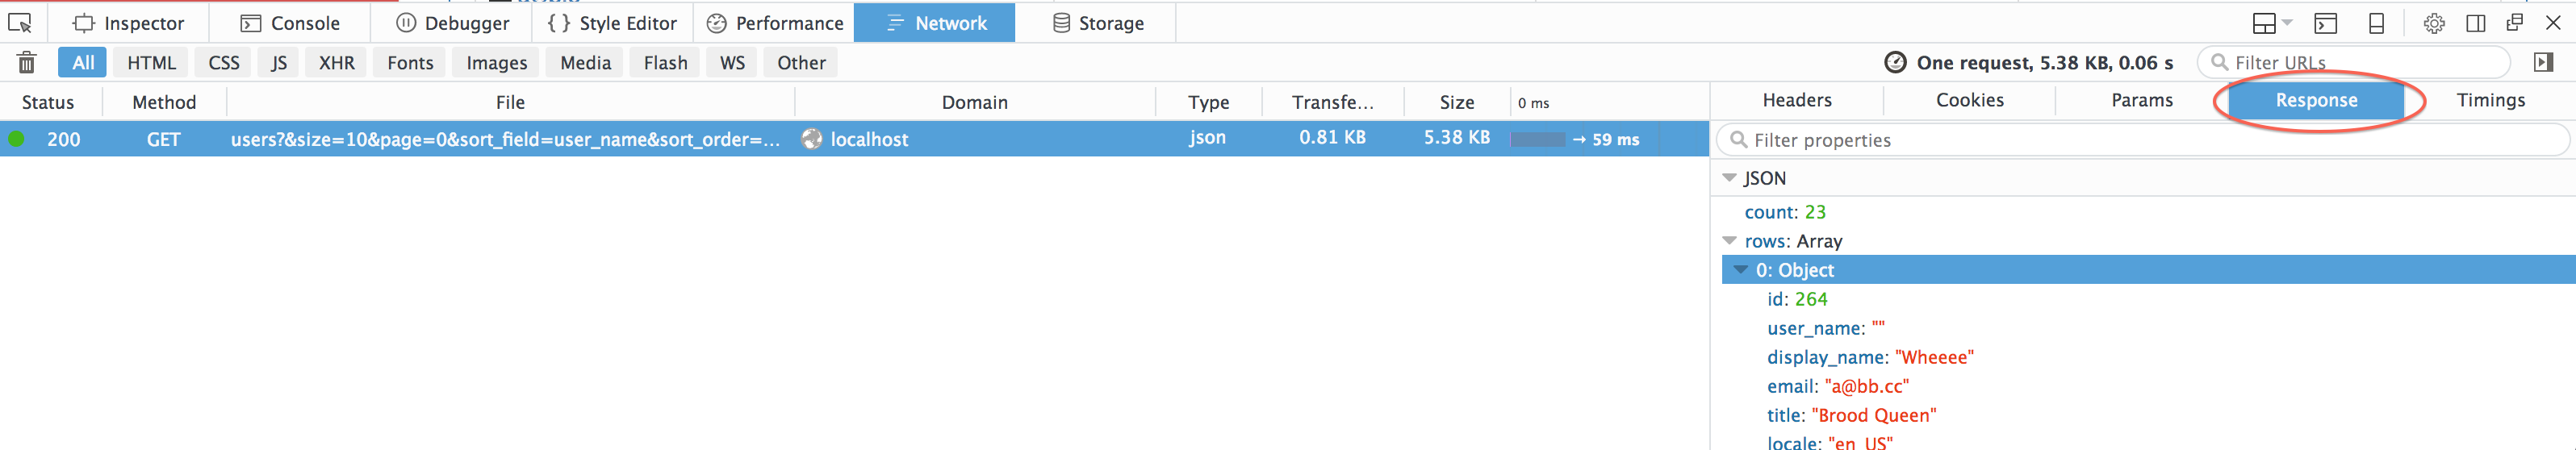
The Response tab shows the data sent in the body of the response. For requests to a URL representing a web page (like the URL in your browser's navigation bar), the response body simply contains the actual HTML returned from the server, that your browser initially renders. For other requests, it could contain images, Javascript, or structured data in some other format. For example in the request shown above, the response contains structured JSON data representing a list of users currently registered with the application.
Again, this is useful in debugging because if you were expecting the client-side of the application to do something after making a particular request to the server, you can confirm that the response contains the data you are expecting.
Other browsers
Other browsers have their own developer tools, which are similar to those found in Firefox.
Chrome
To open Chrome's DevTools feature, press:
- Windows: Ctrl + Shift + J
- MacOS: Cmd + Opt + J
Safari
Check the "Show Develop menu in menu bar" setting in "Settings" -> "Advanced" (screenshot).
Then, to open Safari's Web Inspector:
Cmd + Opt + C
Edge
To open Edge's Developer Tools, press F12. You may then need to click "Open DevTools".
Credit to this answer on Stack Overflow.
Each browser's implementation of the features that we described for Firefox earlier is slightly different, but the information should all be there.
Client-side debug print statements
The most basic debugging tool, and probably the first thing you learned when you started programming, is the print statement. Modern browsers provide their own version of the print statement, console.log(). This can be used to output string literals as well as the values of variables (including structured data like arrays and objects) to the browser console.
For example, we can use it to inspect the contents of a JSON object returned by an AJAX call:
(function( $ ) {
    $.fn.flashAlerts = function() {
        var field = $(this);
        var url = site['uri']['public'] + "/alerts";
        return $.getJSON( url, {})
        .then(function( data ) {        // Pass the deferral back
            // Debugging statement
            console.log(data);

        ...
        });
    }
}
Now, when we do something that triggers this request, the console.log statement will print the contents of the variable data to the browser console:
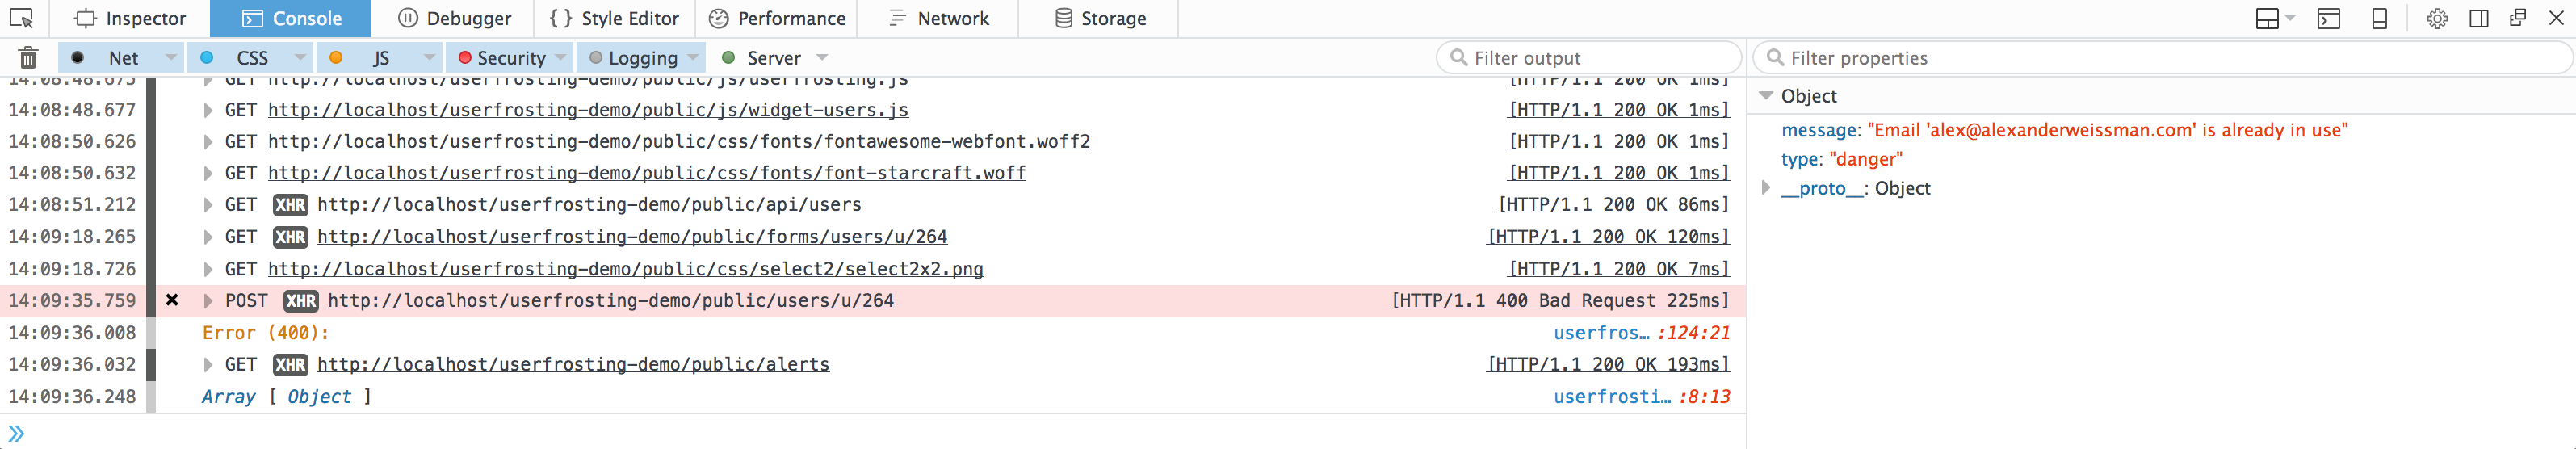
As you can see in the last line of the console output, data is an array containing Javascript objects. If we click on "Object", a panel opens to the right that displays the contents of that object.
Server-side Debugging
So far, we've seen some basic techniques for debugging problems in client-side code (Javascript), and problems in the way that data is being passed back in forth between the client and the server. But what happens when the problem is in the server-side code, i.e., in the PHP?
Runtime Errors
UserFrosting uses a sophisticated error-handling system to capture exceptions that are generated by your code. For example, if you've tried to reference a file that doesn't exist, or call a method with the wrong argument types - that's a runtime error.
By default in development mode only, UserFrosting will show a detailed debugging page that contains a full stack trace. For example:
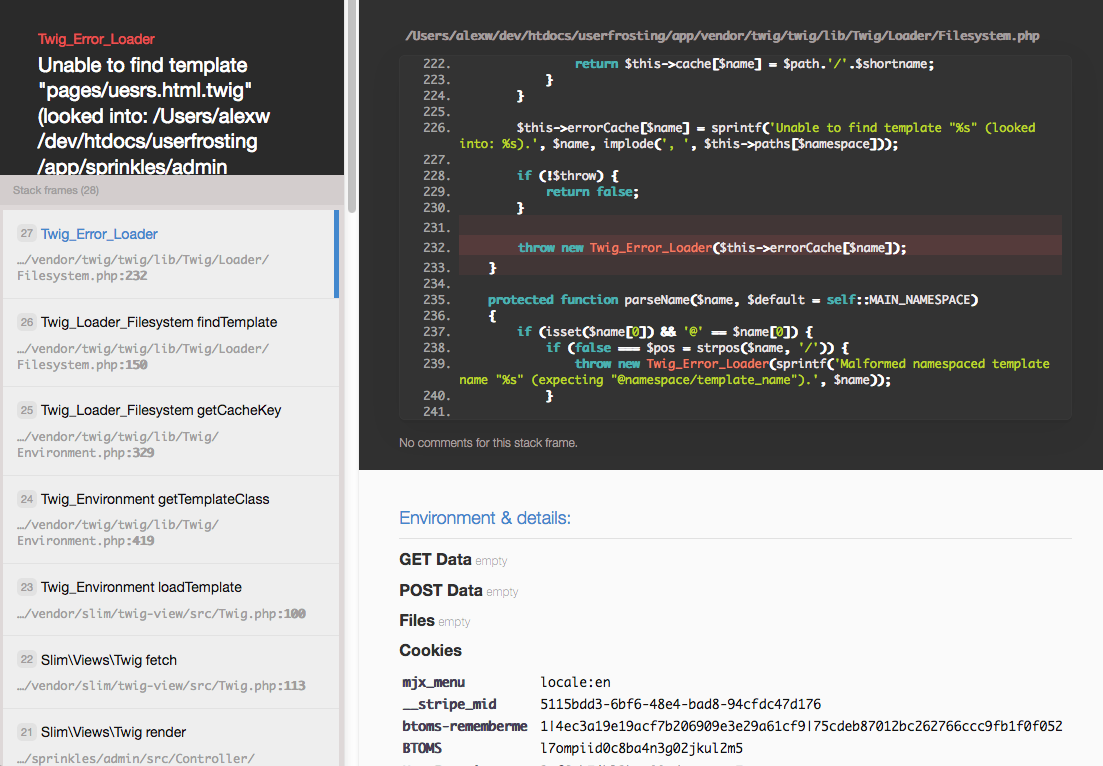
This page will also show you the contents of your request, the current session variables, and your server/environment variables. For obvious reasons, this debugging page is disabled in production.
If a user encounters a runtime error in production (hopefully this will never happen to you!), they will see a generic "server error" message instead, and the details will be logged on the server in app/logs/userfrosting.log. By configuring a custom Monolog processor it is also possible to have runtime errors in production emailed to you, in case you want to be woken up at 4am when the unthinkable occurs.
You can read more about how the error-handling system as a whole works in the Advanced chapter.
Warning
Some runtime errors cannot be caught by the error-handling system - for example, PHP fatal errors, syntax errors or exception in the error handling system itself. If these occur, a plainly formatted error message will be generated. Depending on your settings for PHP's log_errors and display_errors settings, you can determine whether the fatal error message is displayed and/or logged. Both display_errors and log_errors are automatically set by UserFrosting under the php key in your configuration files. If UF detects that display_errors is disabled, it will display a generic "server error" message instead of the actual error. If log_errors is enabled, the actual error message will be logged with PHP's native error logging. You should make sure that you have specified a path to an error log file (what we will call the php error log) with the error_log directive.
Logic Errors
A logic error means that something in your application isn't working properly, though no overt error or exception has been generated. For example a database query that doesn't return the expected results, an access check that blocks a user when it should permit them, or an email that doesn't seem to get sent, would constitute a logic error.
Aside from writing unit tests, the best way to find and resolve logic errors is by enabling UserFrosting's debugging features and looking at your logs/userfrosting.log file.
Query debugging
Query debugging allows you to view the raw SQL queries that are executed in your Eloquent data models and queries. To enable query debugging, set the debug.queries config to true in your configuration file. All successful SQL queries will be logged to app/logs/userfrosting.log:
[2017-06-16 03:41:42] query.DEBUG: Query executed on database [default]: {
    "query": "select * from `users` where `users`.`id` = ? and `users`.`deleted_at` is null limit 1",
    "bindings": [
        1
    ],
    "time": "0.81 ms"
} []
Authorization debugging
Authorization debugging shows you a detailed breakdown of how UserFrosting's authorization component determines whether or not a user passes a particular access control check. To enable authorization debugging, set the debug.auth config to true in your configuration file. Detailed evaluation information will be logged to app/logs/userfrosting.log:
[2017-05-22 13:41:11] auth.DEBUG: Evaluating access condition '!has_role(user.id,2) && subset(fields,['name','email','locale','group','flag_enabled','flag_verified','password'])' with parameters: {
    "user": "[object] (UserFrosting\\Sprinkle\\Account\\Model\\User: {
        ...
    })",
    "fields": [
        "group"
    ],
    "self": {
        ...
    }
} []
[2017-05-22 13:41:11] auth.DEBUG: Evaluating callback 'subset' on:  [
    {
        "expression": "fields",
        "type": "parameter",
        "resolved_value": [
            "group"
        ]
    },
    {
        "expression": "array('name', 'email', 'locale', 'group', 'flag_enabled', 'flag_verified', 'password')",
        "type": "array",
        "resolved_value": "Array\n(\n    [0] => name\n    [1] => email\n    [2] => locale\n    [3] => group\n    [4] => flag_enabled\n    [5] => flag_verified\n    [6] => password\n)\n"
    }
] []
[2017-05-22 13:41:11] auth.DEBUG: Result: 1 [] []
[2017-05-22 13:41:11] auth.DEBUG: Expression '!0 && 1' evaluates to true [] []
[2017-05-22 13:41:11] auth.DEBUG: User passed conditions '!has_role(user.id,2) && subset(fields,['name','email','locale','group','flag_enabled','flag_verified','password'])' .  Access granted. [] []
Mail debugging
The underlying phpMailer instance that we use can generate very detailed information on the low-level processes involved when your code attempts to send email via SMTP. To have PHPMailer send this information to app/logs/userfrosting.log, set mail.smtp_debug to a non-zero value in your configuration file.
The level of detail can be specified with the mail.smtp_debug configuration value, using the values specified in the PHPMailer documentation:
0No output1Commands2Data and commands3As 2 plus connection status4Low-level data output
[2017-06-09 02:05:52] mail.DEBUG: Connection: opening to smtp.example.com:587, timeout=15, options=array (
) [] []
[2017-06-09 02:05:52] mail.DEBUG: Connection: opened [] []
[2017-06-09 02:05:52] mail.DEBUG: SMTP -> get_lines(): $data was "" [] []
[2017-06-09 02:05:52] mail.DEBUG: SMTP -> get_lines(): $str is "220 smtp.example.com ESMTP Hi, I'm a Mail-in-a-Box (Ubuntu/Postfix; see https://mailinabox.email/)
" [] []
[2017-06-09 02:05:52] mail.DEBUG: SMTP -> get_lines(): $data is "220 smtp.example.com ESMTP Hi, I'm a Mail-in-a-Box (Ubuntu/Postfix; see https://mailinabox.email/)
" [] []
[2017-06-09 02:05:52] mail.DEBUG: SERVER -> CLIENT: 220 smtp.example.com ESMTP Hi, I'm a Mail-in-a-Box (Ubuntu/Postfix; see https://mailinabox.email/)
 [] []
[2017-06-09 02:05:52] mail.DEBUG: CLIENT -> SERVER: EHLO localhost
 [] []
[2017-06-09 02:05:52] mail.DEBUG: SMTP -> get_lines(): $data was "" [] []
...
Debug statements
We can also arbitrarily send manual debugging messages to app/logs/userfrosting.log. This is useful when you want to inspect the value of a server-side variable at a particular point in your code ("dumping the variable") or determine if a particular method or function is being called. To do this, simply inject a DebugLoggerInterface :
// Inject `\UserFrosting\Sprinkle\Core\Log\DebugLoggerInterface` with attributes, or through constructor
#[\DI\Attribute\Inject]
protected DebugLoggerInterface $logger;

// ...

$this->logger->debug("Fetching owls from database...");
$this->logger->debug("Owls found:", $owls);
Note
DebugLoggerInterface represents \UserFrosting\Sprinkle\Core\Log\DebugLogger, a wrapper for a Monolog logger instance, whose debug method takes a string as the first parameter and an optional array as a second parameter, and writes them to a log file. Monolog also supports more advanced logging capabilities - check their documentation for more details.
Native PHP logging
If you prefer, you can use the error_log function to log to the PHP error log instead of app/logs/userfrosting.log:
// Print a simple string to the log
error_log("Fetching owls from database...");

// Print an array or object to the log
error_log(print_r($owls, true));
Some developers may find this simpler and more flexible than invoking the DebugLogger.
Data APIs and AJAX Requests
For traditional GET and POST requests, such as navigating to a page or submitting a form using your browser's default submission handling, the default behavior of most browsers is to directly display the response it receives in the main viewport. This is done automatically, so we don't even really think of it as a request-response transaction.
However with the rise of "Web 2.0" and more complex web applications, we've seen the widespread adoption of AJAX for submitting requests and working with response data, all without refreshing the page. Often times, the user doesn't even know that a request has been issued!
As an example, consider the "Users" page, which grabs chunks of user records via the /api/users route and renders them in a paginated table. This data source that we've set up returns a JSON object containing the current chunk of users. The main "Users" page uses an AJAX request to make requests to /api/users, and then it uses the response to dynamically render the table rows.
Handling errors
When an error is generated during an AJAX request, any error messages we receive from PHP via the server's response will get held up inside the XHR object that Javascript uses to process the request. We'll never see these error messages unless we either:
- Explicitly tell our AJAX handler to dump them into the DOM, or;
- Manually inspect the contents of the response using the browser console tools.
This is hardly a convenient and predictable way to get at debugging and error messages!
To solve this problem, UserFrosting's client-side components can automatically replace the current window's contents with the contents of the response body when an error (4xx or 5xx) code is returned during an AJAX request.
To enable this behavior, set site.debug.ajax to true in your sprinkle's configuration file.
Debugging APIs
What about when your API doesn't produce an error, but it doesn't produce the correct response or behavior either?
The best approach is to develop your API in isolation from the page or widget that is consuming the API. For example, if you have a page /members that consumes a /api/members data source, don't try to debug the results generated by the data source through the page that is consuming it.
GET APIs
As it turns out, you can visit /api/members directly in your browser, and it will show you the output of the data source! Since visiting a page in your browser is equivalent to making a GET request, you can append query strings as well:
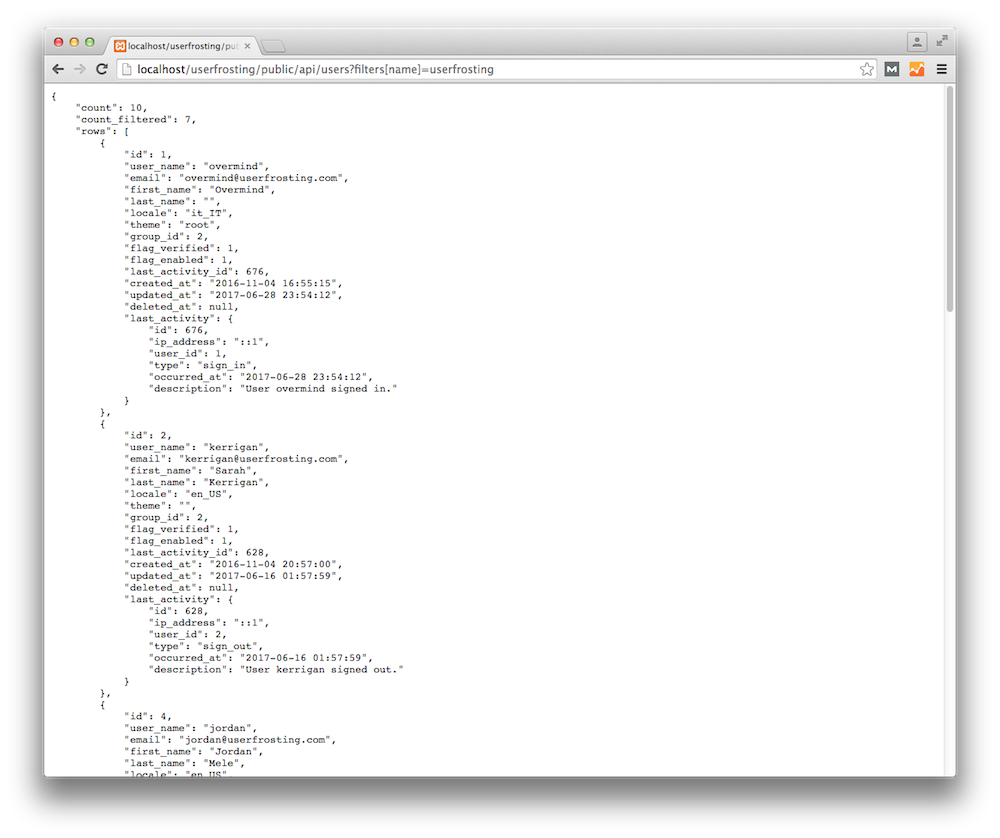
Make sure you get the data API itself working properly and producing the kind of output you expect, before you fiddle with the page and/or Javascript that is consuming the API.
POST, PUT, and DELETE APIs
Your browser is a great way to make and check the response of GET requests, but what about other HTTP methods like POST, PUT, and DELETE? For this, you'll need some extra software that allows you to make these types of requests and view their responses.
Here are some popular options:
- Postman is a standalone application (available for Mac, Windows, and Linux) that provides a convenient interface for making HTTP requests.
- Fiddler, the free web debugging proxy (desktop app)
- RESTClient, a plugin for Firefox