Client-side Debugging
Now that we understand how a modern web application actually works, we can talk about what to do when something goes wrong.
As we mentioned before, a web application is not a single piece of software. It consists of the server running PHP code, the client (browser) running Javascript and rendering the web page, and the conversation between the two parties. Things can go wrong in any of these three places.
When your application "doesn't work", it's not always obvious in which of these three places the problem lies. In general, it's best to start debugging problems on the client side unless you already have a pretty good idea that the problem lies in your server-side code. Fortunately, modern web browsers come with a built-in tool for identifying problems in client-side code, as well as problems in the communication between your browser and the server. This tool is called the browser console.
The browser console can show you error and debug output from the Javascript interpreter, as well as the specific requests that your browser makes and the responses that it gets from the server. It also lets you explore the DOM (the Document Object Model, which is basically the HTML that is rendered in the browser at any given moment), and the specific sequence of CSS transformations that are being applied to each HTML element.
Firefox
To open the console in Firefox, use the following shortcuts:
- Windows: Ctrl + Shift + K
- MacOS: Cmd + Opt + K
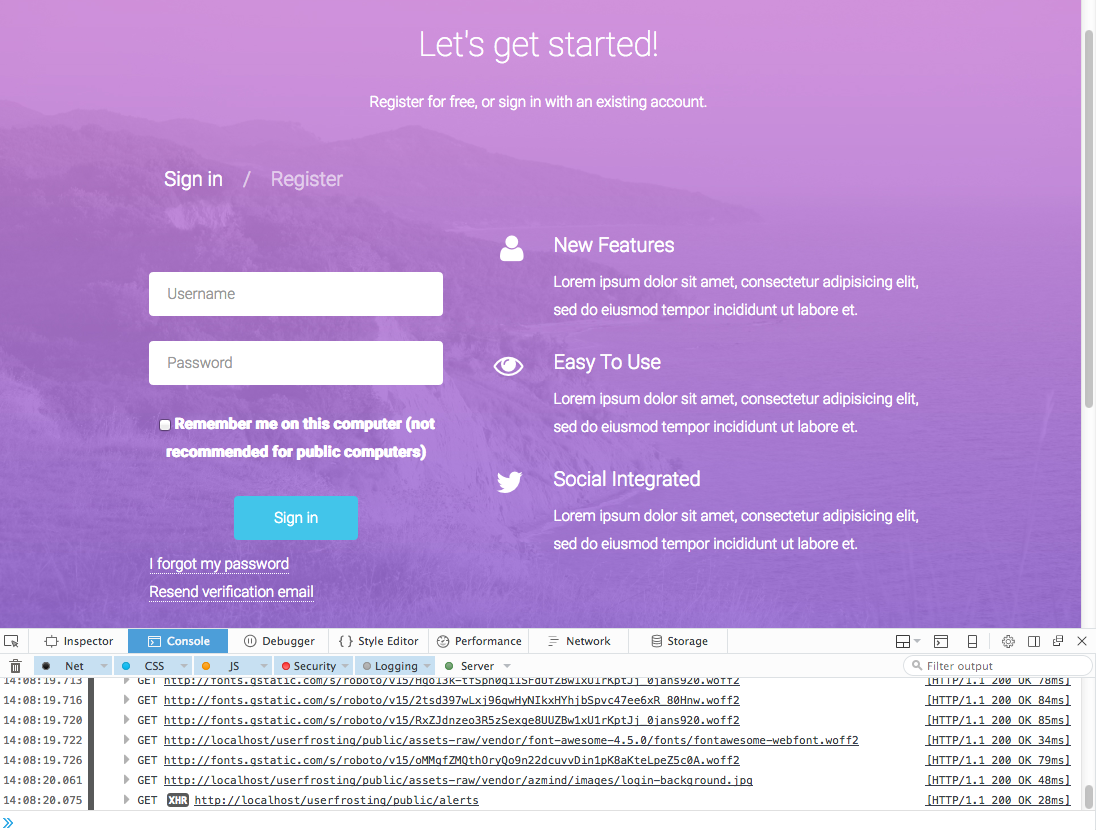
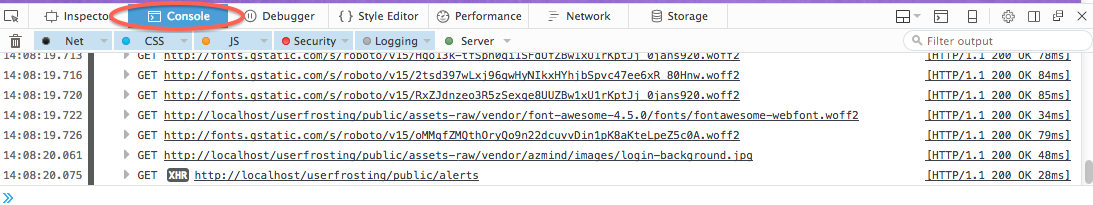
The tool panel will open (usually docked at the bottom) and you'll notice some tabs at the top of this panel: Inspector, Console, Debugger, Style Editor, Performance, Network, and Settings. By default, the Console tab should be selected (if not, click it).
Underneath that, you'll probably see a long list of URLs. These are the requests that your web browser has made so far. To the left of each URL is the request method (GET, POST, PUT, DELETE, etc). To the right is the server response summary. For example, the server responded HTTP/1.1 200 OK for the request to http://localhost/userfrosting/public/alerts. The status code 200 is used to mean that the request completed "successfully". "Success" is something that your server defines - it's just a way for the server to tell your browser that everything went as expected and that it doesn't need to do anything else.
If you click the response summary, Firefox will open the Network tab and show you more details about the request:
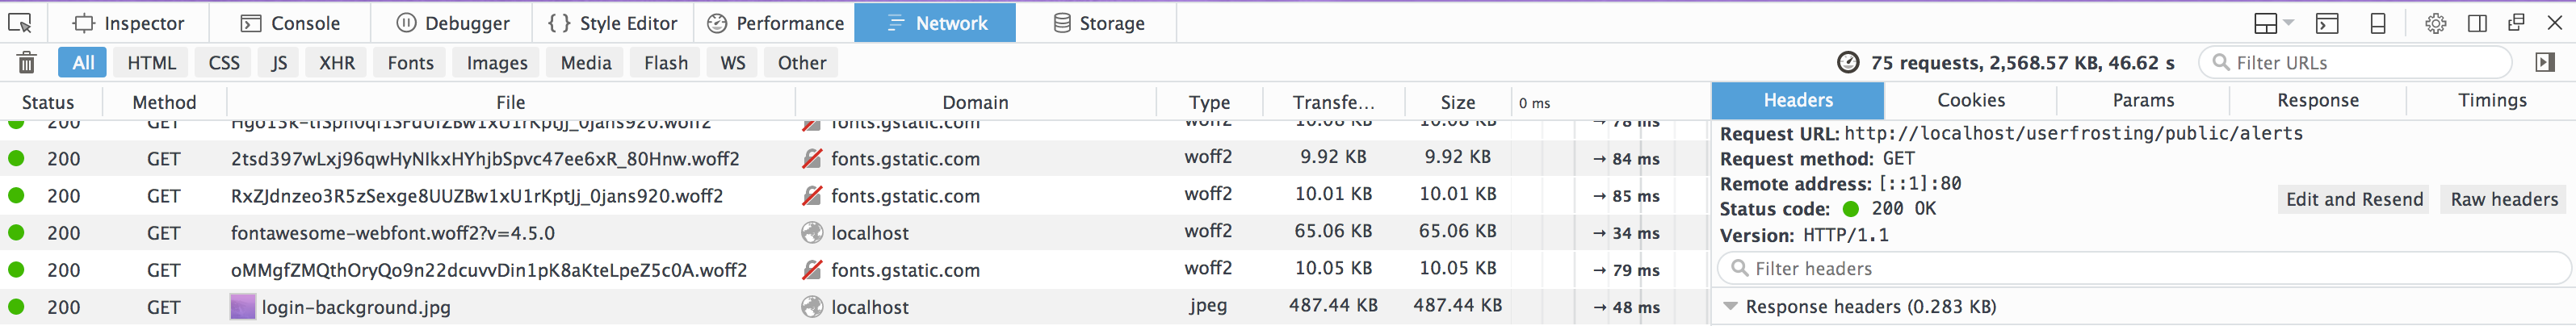
To the right, you'll see tabs for Headers, Cookies, Params, Response, and Timings. If you scroll down in the Headers tab, you'll see a list of the request and response headers. The request headers contain metadata sent with a particular request, and contain information about your browser, the contents of any cookies for the site, and other information. The response headers contain metadata returned by the server for that request. This can include information like cookies that the site wants the client to store or update, as well as things like the type of content (HTML, image, CSS, JSON, etc) being returned.
The Cookies tab just displays the contents of any cookie headers in a more easily read format.
Params tab
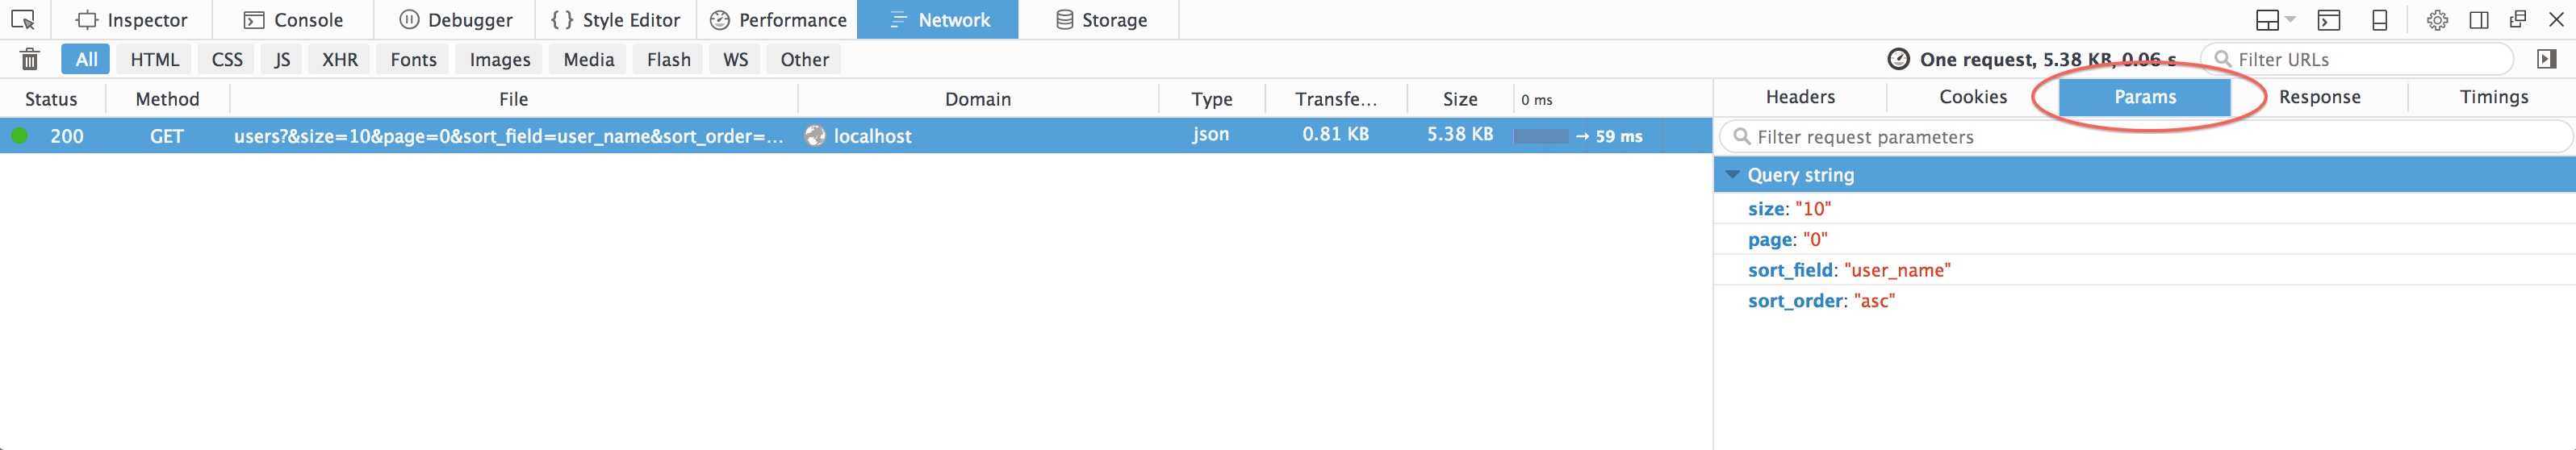
Params shows any data sent in the body of the request. This is extremely useful for debugging client-side code. Often times, a web application appears to "not work" because the server isn't actually being sent the data it expected. The Params tab is a good way to check the actual data that was sent with a particular request.
Response tab
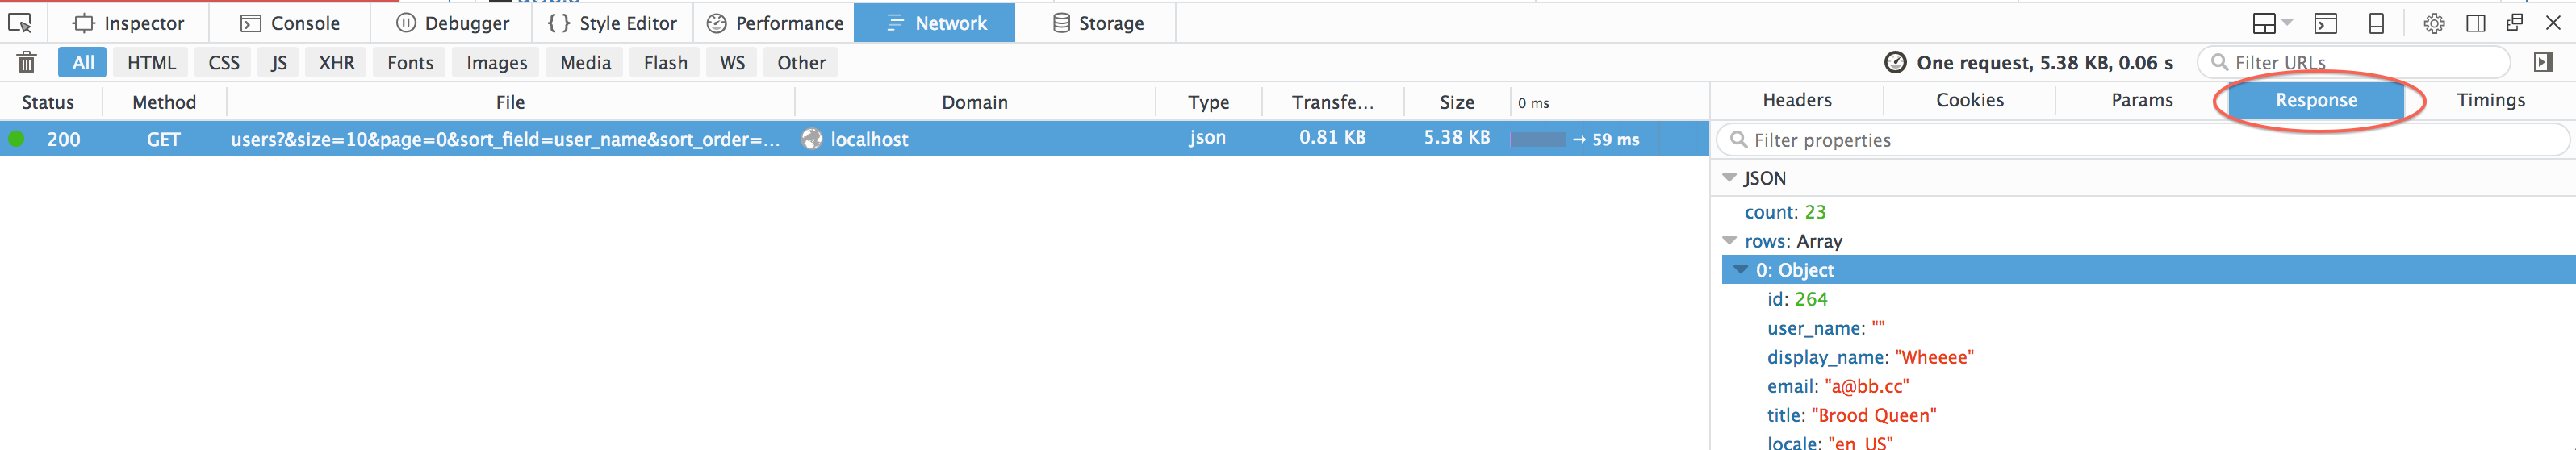
The Response tab shows the data sent in the body of the response. For requests to a URL representing a web page (like the URL in your browser's navigation bar), the response body simply contains the actual HTML returned from the server, that your browser initially renders. For other requests, it could contain images, Javascript, or structured data in some other format. For example in the request shown above, the response contains structured JSON data representing a list of users currently registered with the application.
Again, this is useful in debugging because if you were expecting the client-side of the application to do something after making a particular request to the server, you can confirm that the response contains the data you are expecting.
Other browsers
Other browsers have their own developer tools, which are similar to those found in Firefox.
Chrome
To open Chrome's DevTools feature, press:
- Windows: Ctrl + Shift + J
- MacOS: Cmd + Opt + J
Safari
Check the "Show Develop menu in menu bar" setting in "Settings" -> "Advanced" (screenshot).
Then, to open Safari's Web Inspector:
Cmd + Opt + C
Internet Explorer (and Edge)
To open Internet Explorer's Developer Tools, simply press F12.
Credit to this answer on Stack Overflow.
Each browser's implementation of the features that we described for Firefox earlier is slightly different, but the information should all be there.
Using Debug Print Statements
The most basic debugging tool, and probably the first thing you learned when you started programming, is the print statement. Modern browsers provide their own version of the print statement, console.log(). This can be used to output string literals as well as the values of variables (including structured data like arrays and objects) to the browser console.
For example, we can use it to inspect the contents of a JSON object returned by an AJAX call:
(function( $ ) {
    $.fn.flashAlerts = function() {
        var field = $(this);
        var url = site['uri']['public'] + "/alerts";
        return $.getJSON( url, {})
        .then(function( data ) {        // Pass the deferral back
            // Debugging statement
            console.log(data);

        ...
        });
    }
}
Now, when we do something that triggers this request, the console.log statement will print the contents of the variable data to the browser console:
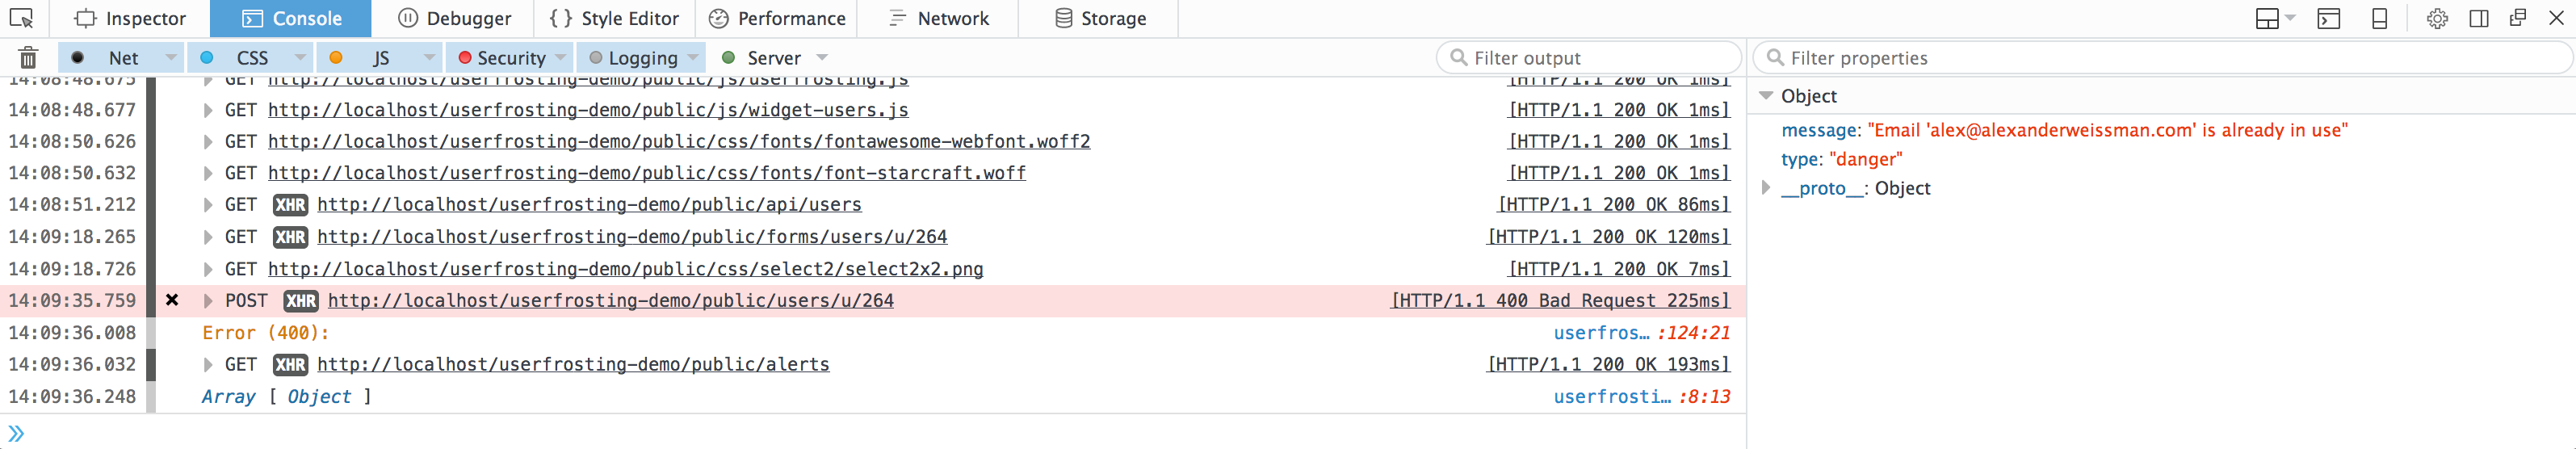
As you can see in the last line of the console output, data is an array containing Javascript objects. If we click on "Object", a panel opens to the right that displays the contents of that object.
Debugging AJAX Requests
Coming soon!